Friday, October 18, 2019

Inflation: A general rise in price level a dollar today can buy less in general that a dollar in the past. (Due to rising prices. Prices increase every year.)
Deflation: A decline in the general price level.
Disinflation: Occurs the inflation rate itself declines
Demand Pull: "Too many dollars chasing too few goods"is triggered by an increase in aggregate demand. Output and employment rise while the price level is also rising . Spending Increases faster than production.
Cost Push: Caused by the rise in per unit. Production costs due to increasing resource cost. triggered by a decrease in aggregate supply. Output and employment decline while the price level is rising.
EX: price of oil, labor,or steel

Shoe Level Cost: Increase cost of transactions caused by inflation.
Menu Costs: Real costs of changing a listed price.

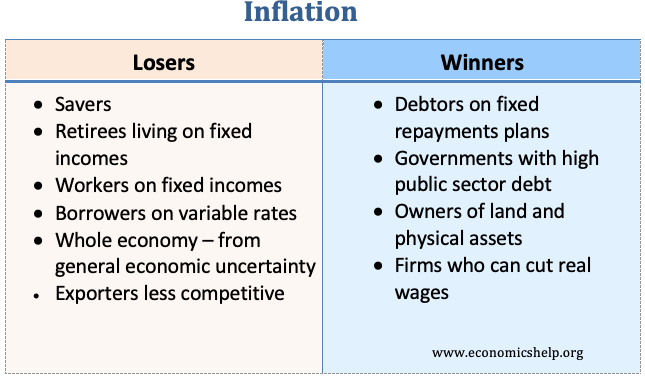
Unanticipated Inflation:occurs when people do not know inflation is going to occur until after the general price level increases. 

COLAS: (cost of living adjustment): Negotiated wages rise with inflation 
Image result for inflation examples
- Grand Parents 


Circular Flow: it shows the flows of money, goods and services and factors of production throughout the economy.
1. Households: A person or group of people who share income house holds own the factors of production 
2. Firms: Organization that produces goods and services firms produce goods by taking input which are your factors of production and turning them into outputs which are your finish products 
3. Government: Providers of public goods and services and demanders of both private goods and services and the factors of production.
2 Markets 
Product market: Goods and services are bought and sold here exchange finished  goods and services for money.

Image result for circular flow diagram

Factor Market/Resource Market:Where resources/capital/labor/are bought and sold 

Business Cycle
 The fluctuation in economic activity that an economy experiences over a period of time.

The 4 Phrases:
 1. Expansion- spending increases and unemployment decreases 
 2. Peak- The highest point of Real GDP, the greatest spending and lowest unemployment however inflation becomes a problem 
 3. Contraction/ Recession- Real GDP declines for 6 months. A reduction of spending levels and increase of unemployment 
 4.Trough- Lowest Point of Real GDP. lowest amount of GDP and highest unemployment. (you have to hit a low point)
Image result for business cycle

Thursday, October 17, 2019

GDP
GDP: Gross Domestic Product- total market value all final goods and services produced within a country's borders within a given year.
GNP: Gross National Product- Measure of what its citizens produce and whether they produce these items within their borders.


C: Consumption Expenditures (67%)
Finish goods and services
Ig: Gross Private Domestic Investment (17%) 
1.Factory equipment maintenance 
2.New Factory Equipment
3. Constructing housing 
4. Unsold Inventory of products built in a year 
G: Government Spending (20%)
The purchased of goods as service
Xn: Net Exports (-4%)
(Exports- Imports)


C+Ig+G+Xn=GDP

NOT COUNTED IN GDP 
1. Used or second-hand goods (Avoid double or multiple counting)
2. Gifts or transfer payments- Transfering money from one person to another.
-produces no output
-Public: Ex: Social Security, Welfare
-Private : Ex: Scholarship  
3. Stocks and Bonds
- Purely financial transactions 
-No output produced 
4. Unreported Business Activities (tips)
5.Illegal activities (underground)
6.Non- Market Activities (babysitting, volunteering)
7. Intermediate Goods (Avoid double or Multiple counting )


Expenditure Approach: were adding up all the spending produced in a given year (C+Ig+G+Xn=GDP)
Income Approach: all consumers how much money they make with a given year. (W+R+I+P)