Friday, December 13, 2019

Monetary Policy/ omo's

Monetary Policy
  • Open Market Operations (OMO): When the Fed buys or sells bonds. 
  • Discount Rate: FDIC member banks and other eligible institution may borrow short term loans from the Fed (bank borrow from the Fed)
  • Federal Funds Rate: FDIC member banks loan each other overnight funds. (banks borrow from other banks)
  • Reserve Requirement: The required amount a bank must keep on hand by law
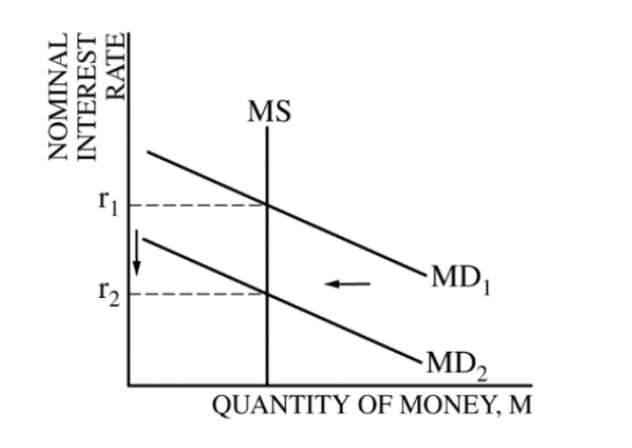
  • In a recession
    • Open Market Operations: The Fed buys bonds (Increase Reserve)
    • Discount Rate: Decrease
    • Reserve Requirement: Decrease
    • Federal Funds Rate: Decrease
    • Money Supply: Increase
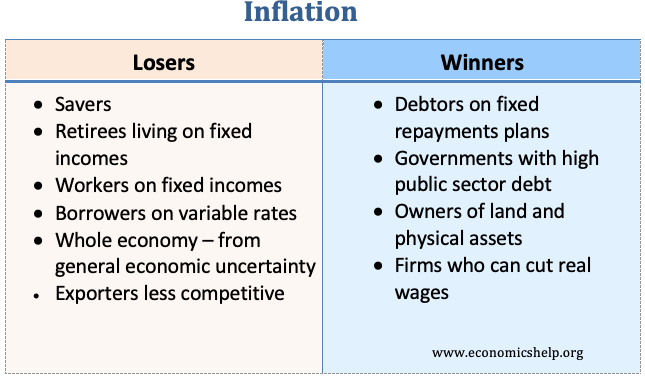
  • In an inflation
  • Image result for monetary policy and omos
    • Open Market Operations: The Fed sells bonds (Decrease Reserve)
    • Discount Rate: Increase
    • Reserve Requirement: Increase
    • Federal Fund Rate: Increase
    • Money Supply: Decrease


The loanable funds market

Loanable Funds Market
  • The market savers and borrowers exchange funds (QLF) at the real rate of interest (r%)
  • Demand for loanable funds or borrowing comes from households, firms, government, and foreign sector
  • Demand for the loanable fund is in fact supply of bonds
  • Supply of loanable fund or saving comes from the household, firms, government, and foreign sector
  • Supply of loanable fund is also demand for bonds
Changes in Demand for Loanable Funds
  • Demand for loanable fund = borrowing (i.e. supplying bonds)
  • More borrowing = more demand for the loanable fund (shift to the right)
  • Less borrowing = less demand for the loanable fund (shift to the left)
  • Examples:
    • Government deficit spending = more borrowing = more demand for loanable fund = DLF shift to the right = real interest rate (r%) increase
    • Less investment = less borrowing = less demand for loanable fund = DLF shift to the left = real interest rate (r%) decrease 
Changes in Supply of Loanable Funds
  • Supply of loanable funds = saving (i.e. demand for bonds)
  • More saving = more supply of loanable fund (shift to the right)
  • Less saving = less supply of loanable fund (Shift to the left)
  • Examples:
    • Government budget surplus = more saving = more supply of loanable fund = SLF shift to the right = r% decrease
    • A decrease in consumers' MPS = less saving = less supply of loanable fund = SLF shift to the left = r% increase

Image result for the loanable funds market graph

The money market

Money Market
  • A market where Fed and users of money interact this determining the nominal interest rate (i%)
  • Money demand (AD) comes from households, firms, government and the foreign sector
  • Money supply (MS) is determined only by the Federal Reserve
Money Demand
  • Transaction Demand: Demand for money as a medium of exchange (independent of the interest rate)
  • Asset Demand: Demand for money as a store of value (dependent on the interest rate)
  • Total Money Demand: MD is downward sloping because, at high-interest rates, people are less inclined to hold money and more inclined to hold stocks and bonds
    • At lower interest rates, people sacrifice less when they hold money
Money Supply
  • Determined by Federal Reserve because the Fed has monopoly control over the supply of money


Image result for the money market graph

Money

Types of Multiple Deposit Expansion Question
Type 1: Calculate the initial change in ER
-aka. the amount a single bank can loan from the initial deposit
Type 2: Calculate the change in loans in the banking system
Type 3: Calculate the change in the money supply
-Sometimes Type 2 and Type 3 will have the same result (i.e. no Fed involvement)
Type 4: Calculate the change in DD
Functions of the FED
  1. It issues paper currency
  2. Sets RR and holds reserves of banks
  3. It lends money to banks and charges them interest
  4. They are a check clearing service for banks
  5. It acts as a personal bank for the government
  6. Supervises member banks
  7. Controls the money supply in the economy
Uses of Money
  1. Medium of Exchange
    • Serves to trade one product to another
  2. Unit of Account
    • Establishes economic growth
  3. Store of Value
    • Money holds it's valued over a period, whereas products may not
Types of Money
  1. Representative Money
    • Paper money is backed by something tangible that gives its value.
      • Example: IOU
  2. Commodity Money
    • Gets its a value from the type of material from which it's made
      • Example: Gold, silver
  3. Fiat Money
    • Money because the government says so
Characteristics of Money
  1. Durability
  2. Portability
  3. Divisibility
  4. Acceptability
  5. Uniformity
  6. Scarcity
  7. Limited supply
Money Supply
    • M1
      • Currency(coins of cash)
      • Checkable Deposits -> Demand Deposits -> Checking accounts
      • Traveler's checks
    Liquidity- easily to convert to cash
    • M2
      • Consists of M1 money +
      • Savings accounts +
      • Money market accounts
    -Not as liquid
    -Saving
    • M3
      • M2 + Certificates of deposit
    Time Value of Money
    v = future value of $
    p = present value of $
    r = real interest rate (nominal rate - inflation rate) expressed as a decimal
    n = years
    k = number of times interest is credited per year Simple Interest Formula: v = (1+r)^n * p
    The Compound Interest Formula: v = (1+r/k)^nk *p

    Balance/Business Sheet
    -Summarizes the financial position of the bank at a certain time
    -The value of assets must equal liabilities.

    Assets (Left side)
    • Required Reserves (RR)
    • Excess Reserves (ER)
    • Bonds
    • Loans
    • Property
    Liabilities (Right side)
    • Demand Deposits
    • Owner's Equity
    • Net worth
    Owner's Equity
    Based on how much you invested into stock
    Net Worth- What you've earned

    Money Creation
    -Putting new money into circulation

    2 Ways
    1. When the Fed buys bonds from the public or from a financial institution (OMO, Open Market Operation)
    2. When the banks make loans to the public
    -The money supply is increased when banks make loans.
    -The more loans banks make, the more money there is in circulation.
    -A bank can loan any amount that is in excess of its required reserves.
    -The banking system can create loans in multiples of an original loan
    -Reserves of total reserves are the number of deposits that a bank has accepted but not loaned out.
    -Required Reserves- are the amount a bank must keep on hand by law
    -The RRR(Required Reserve Ratio) determines this amount
    -Banks make money off interest.


    Image result for creation OF MONEY

    Balance of payment Unit 7

    Balance of Payments
    • The measure of money inflows and outflows between the US and the rest of the world (ROW)
      • Inflows are credits
      • Outflows are debits
    • Balance of Payments is divided into 3 accounts 
      • Current account
      • Capital / financial Account
      • Balance of Payments
      • The measure of money inflows and outflows between the US and the rest of the world (ROW)
      • Inflows are credits
      • Outflows are debits
      • Balance of Payments is divided into 3 accounts 
      • Current account
      • Capital / financial Account
      • Official Reserves Account
      • Official Reserves Account
    • Current Account
      • Balance of Trade or Net Exports
      • Exports of goods/services - imports of goods/services
      • Exports create a credit to the balance of payment
      • Imports create a debit to the balance of payment

      • Net Foreign Income
        • (Income earned by U.S. owned foreign assets) - (Income paid to foreign U.S. assets)
        • Example: Interest payments on U.S. owned Brazillian bonds - Interest payment on German-owned U.S. treasury bonds
      • New Transfers (tend to be unilateral)
        • Foreign Aid is a debit to the current account
        • Example: Mexican migrant workers send money to family in Mexico
      • Relationship Between Current and Capital Account
        • Zero each other out
        • The current account has a negative balance (deficit) then capital account have a positive balance (surplus)
      • Official Reserves
        • Foreign currency holdings of the US Federal Reserve System
        • When there is a balance of payments surplus the Fed accumulates foreign currency and debits the balance of payments
        • When there is a balance of payments deficit, the Fed depletes its reserve of foreign currency and credits the balance of payments
        • The Official Reserves zero out the balance of payment


    Image result for balance of payments


    Friday, October 18, 2019

    Inflation: A general rise in price level a dollar today can buy less in general that a dollar in the past. (Due to rising prices. Prices increase every year.)
    Deflation: A decline in the general price level.
    Disinflation: Occurs the inflation rate itself declines
    Demand Pull: "Too many dollars chasing too few goods"is triggered by an increase in aggregate demand. Output and employment rise while the price level is also rising . Spending Increases faster than production.
    Cost Push: Caused by the rise in per unit. Production costs due to increasing resource cost. triggered by a decrease in aggregate supply. Output and employment decline while the price level is rising.
    EX: price of oil, labor,or steel

    Shoe Level Cost: Increase cost of transactions caused by inflation.
    Menu Costs: Real costs of changing a listed price.

    Unanticipated Inflation:occurs when people do not know inflation is going to occur until after the general price level increases. 

    COLAS: (cost of living adjustment): Negotiated wages rise with inflation 
    Image result for inflation examples
    - Grand Parents 


    Circular Flow: it shows the flows of money, goods and services and factors of production throughout the economy.
    1. Households: A person or group of people who share income house holds own the factors of production 
    2. Firms: Organization that produces goods and services firms produce goods by taking input which are your factors of production and turning them into outputs which are your finish products 
    3. Government: Providers of public goods and services and demanders of both private goods and services and the factors of production.
    2 Markets 
    Product market: Goods and services are bought and sold here exchange finished  goods and services for money.

    Image result for circular flow diagram

    Factor Market/Resource Market:Where resources/capital/labor/are bought and sold 

    Business Cycle
     The fluctuation in economic activity that an economy experiences over a period of time.

    The 4 Phrases:
     1. Expansion- spending increases and unemployment decreases 
     2. Peak- The highest point of Real GDP, the greatest spending and lowest unemployment however inflation becomes a problem 
     3. Contraction/ Recession- Real GDP declines for 6 months. A reduction of spending levels and increase of unemployment 
     4.Trough- Lowest Point of Real GDP. lowest amount of GDP and highest unemployment. (you have to hit a low point)
    Image result for business cycle

    Thursday, October 17, 2019

    GDP
    GDP: Gross Domestic Product- total market value all final goods and services produced within a country's borders within a given year.
    GNP: Gross National Product- Measure of what its citizens produce and whether they produce these items within their borders.


    C: Consumption Expenditures (67%)
    Finish goods and services
    Ig: Gross Private Domestic Investment (17%) 
    1.Factory equipment maintenance 
    2.New Factory Equipment
    3. Constructing housing 
    4. Unsold Inventory of products built in a year 
    G: Government Spending (20%)
    The purchased of goods as service
    Xn: Net Exports (-4%)
    (Exports- Imports)


    C+Ig+G+Xn=GDP

    NOT COUNTED IN GDP 
    1. Used or second-hand goods (Avoid double or multiple counting)
    2. Gifts or transfer payments- Transfering money from one person to another.
    -produces no output
    -Public: Ex: Social Security, Welfare
    -Private : Ex: Scholarship  
    3. Stocks and Bonds
    - Purely financial transactions 
    -No output produced 
    4. Unreported Business Activities (tips)
    5.Illegal activities (underground)
    6.Non- Market Activities (babysitting, volunteering)
    7. Intermediate Goods (Avoid double or Multiple counting )


    Expenditure Approach: were adding up all the spending produced in a given year (C+Ig+G+Xn=GDP)
    Income Approach: all consumers how much money they make with a given year. (W+R+I+P)


    Friday, September 6, 2019

    Supply and Demand

    Demand is the quantities that people are willing/able to buy at various prices.
    Causes in Change of Demand
    1. Δ in # Buyers
    2.Δ in Buyers taste
    3. Δ in income: inferior goods & Normal goods 
    4. Δ In price related goods: Substitute & Complimentary Goods
    5.Δ in expectations 

    Image result for supply and demand


    Image result for supply and demandSupply is the quantities that suppliers are willing and able to produce at various prices.                
    Causes in change of supply 

    1Δ in# of sellers
    2. Δ in Cost of production
    3. Δ in weather
    4. Δ in Technology
    5. Δ in Taxes or Substitutes
    6. Δ in Expectations 


    Price Ceiling & Price Floor

    Price ceiling & Price floor


    Image result for price ceiling and price floor


    Cost of production

    Cost of production 
    • Fixed cost: A costs that does not change no matter how much is produced 
    Image result for fixed cost isEx: Mortgage


    • Variable Costs- A cost that rises or falls depending on how much is produced
    Image result for variable cost isEx: Electricity bills


    Image result for Total costs is
    • Total Costs: Fixed Costs + Variable Costs


    • Marginal Revenue: Additional income from selling one more unit of a good. 
    • Marginal Costs: The cost of producing one more unit of a good.

    Image result for marginal costs

    • Total Revenue: Price x Quantity 

     Go to:


    Price and Elasticity of Demand

    PRICE ELASTICITY OF DEMAND- A measure of how consumers react to change in price 

    ELASTIC- Very sensitive to a change in price 
    They are substitutes( not a necessity)
    E>1 
    Ex:Soda, Steak, Fur Coat 

    INELASTIC- Not very sensitive t a change in price
    few or no substitutes ( a necessity)
    E<1
    Ex: Insulin,Milk,Gas

    Image result for price elasticity of demandUNITARY- E=1 

    STEPS

    1. Quantity
    • New- Old/ Old
    1. Price
    • New-Old/Old
    1. PED

    %Δ in Quantity / %Δ in price